Training and Evaluating a Model

I just want to drink coffee and build stuff
This is the second phase of this project. In this phase, I will be training and evaluating datasets on Google AutoML Vision on how different factors affect the output of a model. The first phase of this project which is creating and annotating dataset with Appen can be found here .
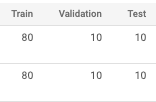
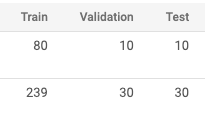
The dataset is divided into four categories all in each category's zip folder. Each dataset was automatically split into 80% training, 10% validation and 10% testing.
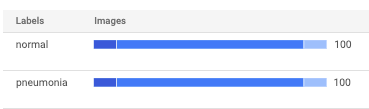
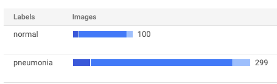
- Clean and balanced dataset containing 100 images of healthy lungs and 100 images of pneumonia diseased lungs.
Splitting dataset:
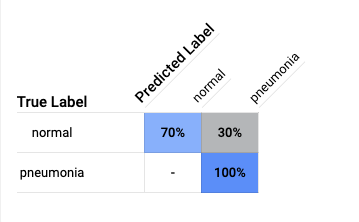
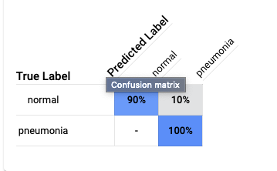
Confusion Matrix:
The model was better at classifying the diseased lungs than the healthy lungs.
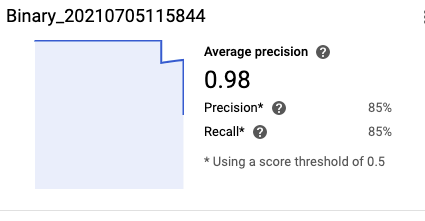
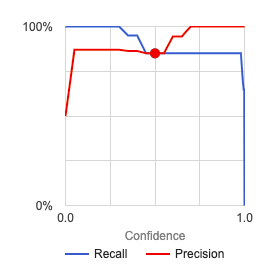
Precision and Recall:
The model had an average of 98% precision, with 85% precision and 85% recall using a score threshold 0f 0.5.
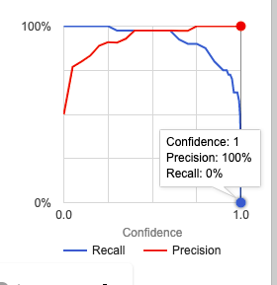
Score Threshold:
When the threshold was increased to 1, the precision approached 1 while the recall approached 0.
- Clean and unbalanced dataset containing 100 images of healthy lungs and 300 images of pneumonia diseased lungs.
Splitting dataset:
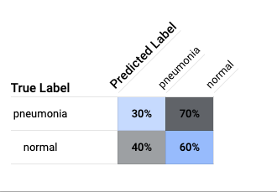
Confusion Matrix:
The model improved in classifying healthy lungs without any improvement to classifying the diseased lungs.
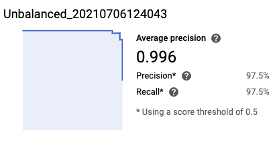
Precision and Recall:
The model had an average of 99.6% precision, with 97.5% precision and 97.5% recall using a score threshold 0f 0.5.
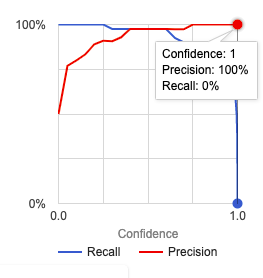
Score Threshold:
Unbalanced data introduces bias which impacts the accuracy of the model. With the increase in accuracy, the recall didn't change. A comparison image.
- Dirty and balanced dataset containing 100 images of healthy lungs and 100 images of pneumonia diseased lungs, with 30% of images from each class swapped.
Confusion Matrix:
The model performed poorly as seen in the diagram below.
Precision and Recall:
The model had an average of 47.7% precision, with 45% precision and 45% recall using a score threshold 0f 0.5.
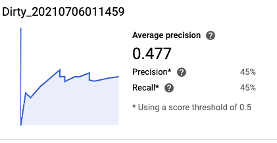
Score Threshold:
The model clearly struggled to find patterns among the classes as the labels were mixed up. The model sees the same pattern in both resulting in poor performance.
- Three class dataset containing 100 images of healthy lungs, 100 images of viral pneumonia lungs and 100 images of bacterial pneumonia lungs.
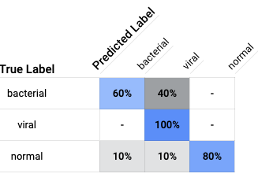
Confusion Matrix:
By intuition, the bacterial and the viral diagrams are likely to be confused. But the model was able to classify the viral pneumonia accurately with false positive in the bacterial and healthy images.
Precision and Recall:
The model had an average of 90.5% precision, with 85.19% precision and 76.67% recall using a score threshold 0f 0.5.
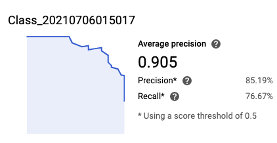
F1 Score:
The F1 score is pegged at 80.701%
Conclusion:
Anomalies in datasets can impact the performance of a model. Overall, the best performing models were the clean and balanced model and the clean and unbalanced model. The report of this phase can be found in my repo and you can connect with me on LinkedIn .


