Data Annotation and Labelling

I just want to drink coffee and build stuff
According to Appen, data annotation is the categorization and labeling of data for AI applications. This categorization and labeling is done to achieve a specific use case in relation to the business problem you are trying to solve.
There are people whose job it is to annotate these data for machine learning application, and are called annotators. These annotators without test validation can lead to bias in data as humans are unconsciously bias and could lead to inaccurate or improper labelling.
I will be demonstrating the use of annotating software provided by Appen to create annotation for detecting pneumonia in an X-ray image.
Overview:
Pneumonia is a respiratory disease that hospitalizes more than 500,000 Americans with a high mortality rate. This disease cuts across all age demographics with infants and the elderly being high risks. Despite all, this disease can be treated and can be prevented using vaccines.
In this project, annotators would be helping us identify images with pneumonia symptoms from the x-ray images for easier identification aiding precision medicine for healthcare practitioners.
Steps:
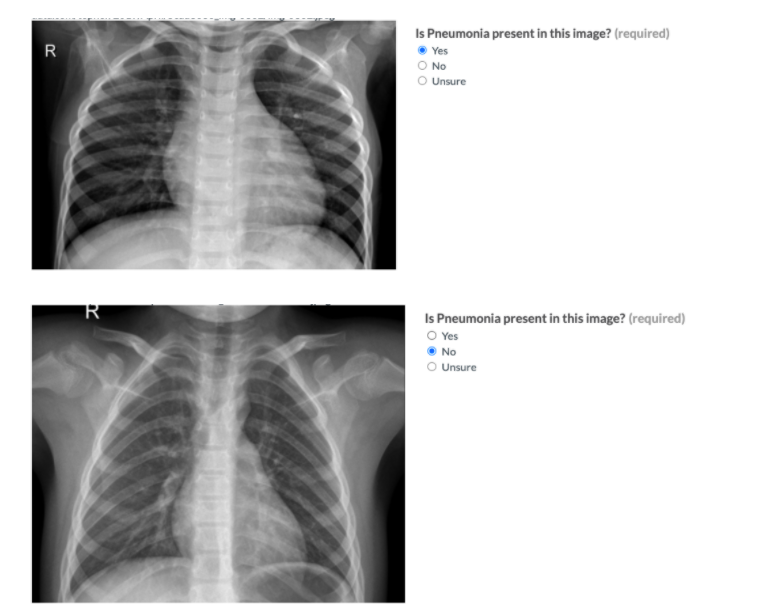
To make this a success, three labels is provided; yes to indicate the presence of pneumonia, no to indicate the absence of pneumonia and unsure if the annotator isn't sure in the situation that testers assigned do not have domain knowledge and to give room for mild cases and false positives. The following steps needs to be followed:
Examine the image carefully.
If Pneumonia is present, select yes. If it is absent, select no. If unsure, mild case or undecided, mark unsure.
Rules:
Only look for the indications of pneumonia.
If there are no indications, mark unsure.
To make the above exercise less stressful, example images are attached to differentiate the indicators of a healthy lung and a pneumonia diseased lung.
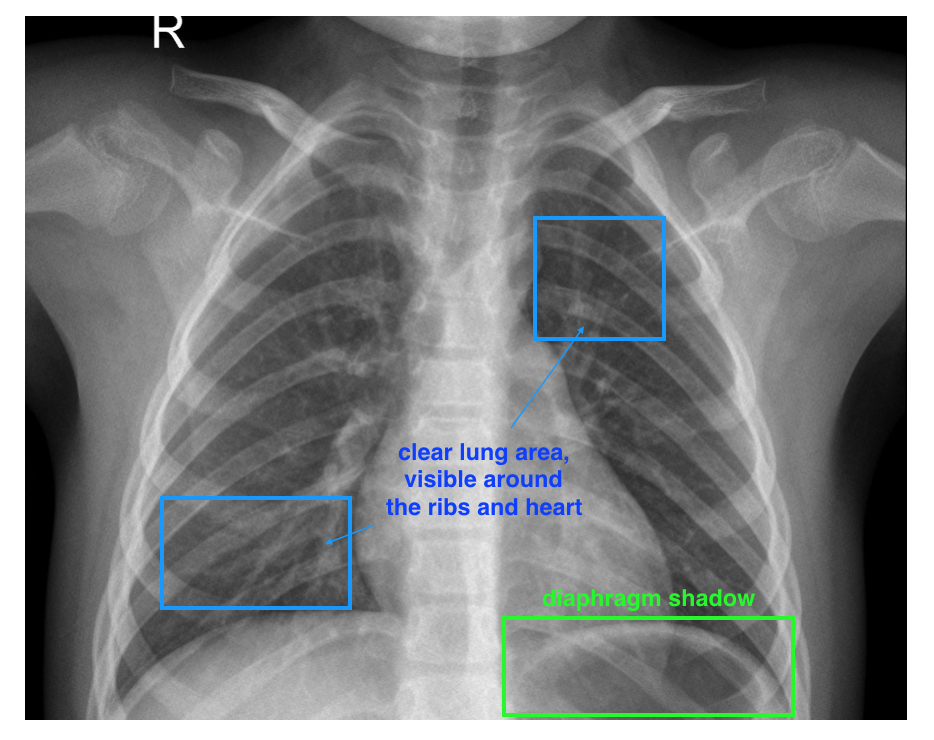
A healthy lung is characterized by:
Clear lung area, visible around the ribs and heart.
Diaphragm shadow.
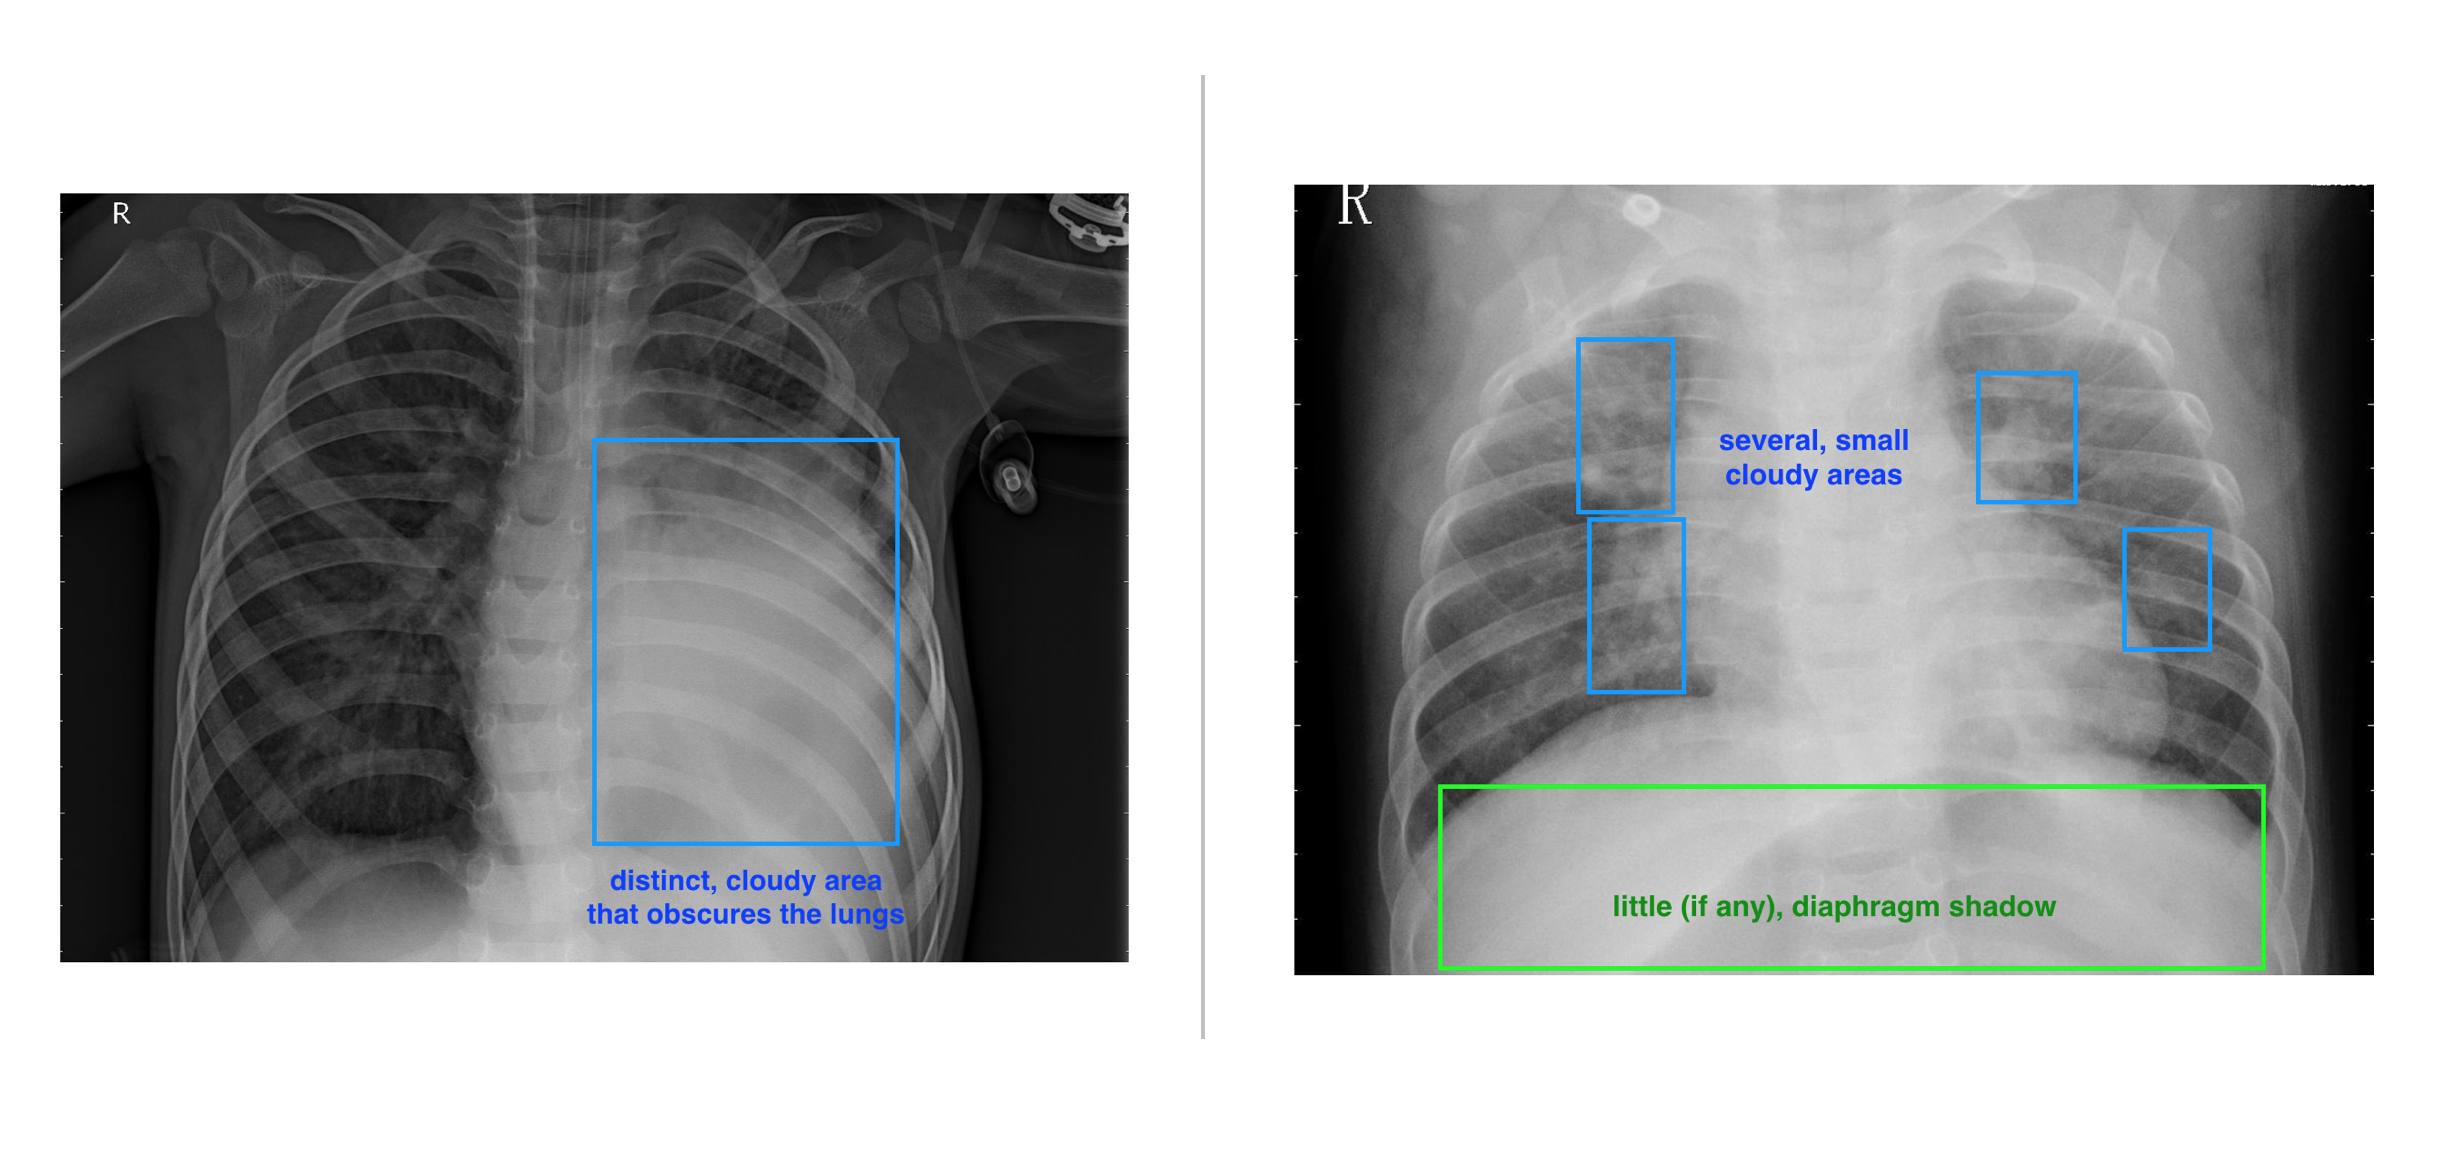
A Pneumonia diseased lung is characterized by:
Distinct cloudy area that obscures the lungs.
Several small cloudy area.
Little or no diaphragm shadow.
Even with all these steps, there is room from bias which includes:
The effect of the brightness or opacity of image which can cause a healthy lung to look diseased. This bias can be improved by using devices with the same specifications or an offset is applied to images with devices of different specifications.
Algorithm bias can also be a factor. This bias stems from the developments and training pattern of the model and can be reduced with A/B testing.
Test:
I went ahead to create 25 test questions to provide the testers a means of evaluating unclear cases and provide confidence in choices made.
When carrying out these annotations, bear in mind to design for longevity by including domain experts in data labelling, feedback on the current set of examples, questions or tips, a user study on instruction and example quality.
Conclusion:
Data annotation is an important process of any machine learning application as it is the foundation on which performing models are built. All examples, data and proposal can be found in my Github and you can connect with me on LinkedIn . This project is part of my AI for Product Management course.


