


Electronic Health Record (EHR) according to Wikipedia is the systematized collection of patient and population health information stored electronically in a digital format. These records are shared through network-connected or other information networks and exchanges. EHRs may include a range of data, from demographics, medical history, medication and allergies to immunization status, laboratory test results, radiology images, vital signs, personal statistics like age and weight, and billing information.
This project is a hypothetical case of a data scientist working with EHR for patient selection for diabetes drug testing and it is one of my projects from AI for Healthcare nanodegree program. This project is to demonstrate the importance of building the right data representation at the encounter level, with appropriate filtering and preprocessing/feature engineering of key medical code sets. And will also require students to analyze and interpret their model for biases across key demographic groups.
Interest Parties:
Pharmaceutical industry and regulators.
Task:
Build a regression model that can predict the estimated hospitalization time for a patient and use this to select/filter patients for your study.
Dataset:
This project was done with dataset from UCI Irvin which has been modified.
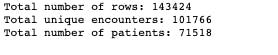
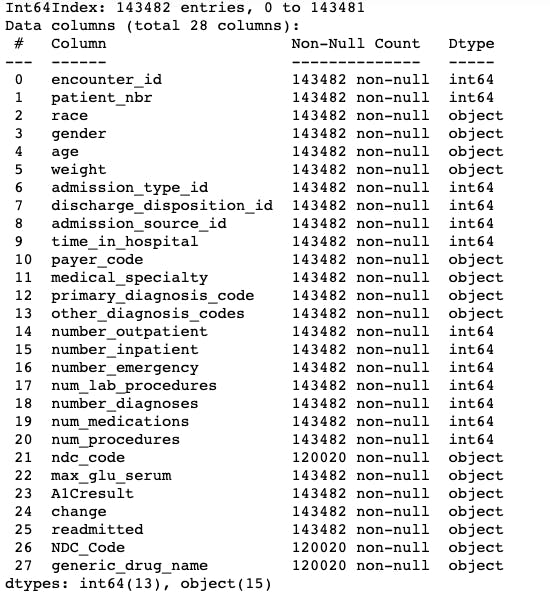
I determined the level of dataset by comparing the number of records to the number of encounters. The number of record was greater than the number of encounters making this a line dataset level.
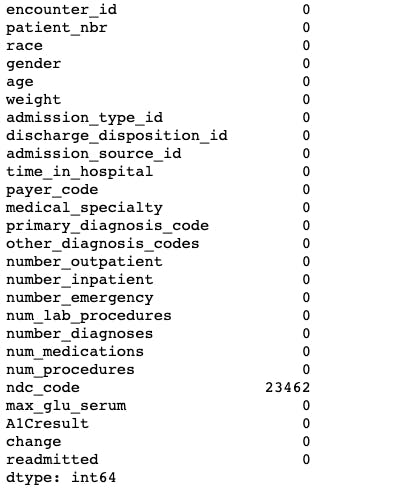
Next, I analyzed the dataset and found:
a. Field(s) with high amount of missing/zero values:
weight
A1Cresult
medical_specialty
payer_code
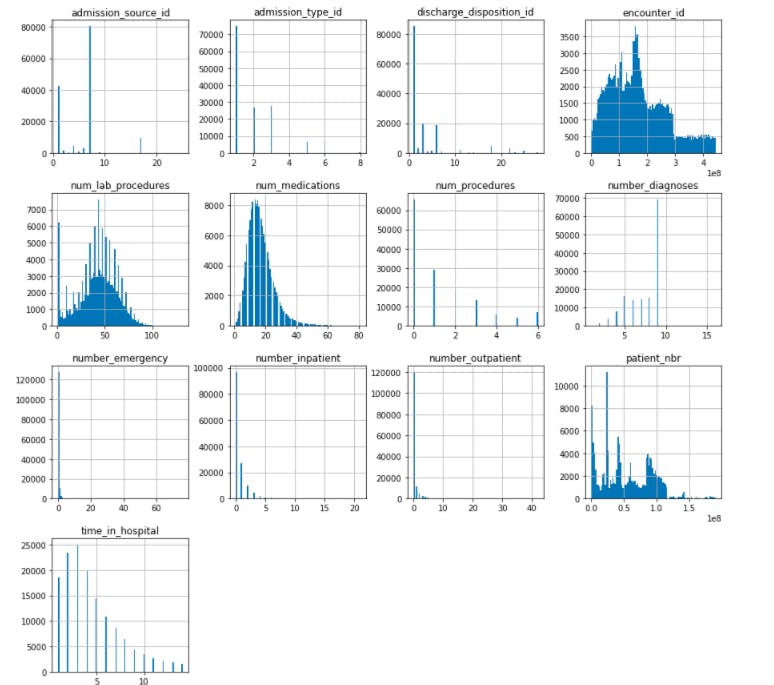
b. Numerical fields had Gaussian/normal distribution
num_medications
num_lab_procedures
time_in_hospital
c. Fields with high cardinality
other_diagnosis_codes: 19374
primary_diagnosis_code: 716
ndc_code: 251
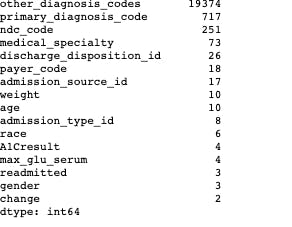
These fields have high cardinality because they are codes and are created on the basis of diagnosis and medication in relation to the lesson taught.
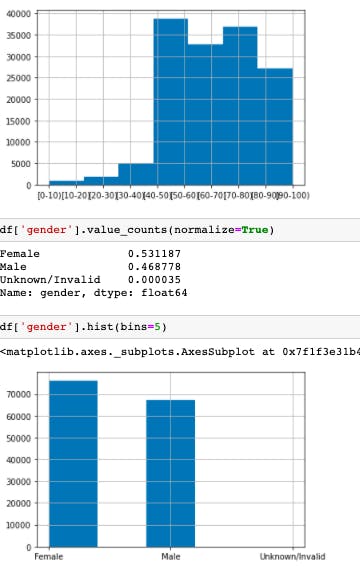
d. The demographic distribution.
Age: Age distribution in the population is between 40-90 with maximum count of 70-80.
Gender: Female population is higher than male population.
It is also noted that female population in the age group from 0-40 and 70-100 is higher while the male population is higher in the age group of 40-70.
Then I reduced the dimensionality of the NDC code feature.
Then I simplified the aggregation of data for the model to prevent data leakage future patient encounters and to reduce complexity of the data transformation and modeling steps by selecting only the first encounter of patients. Which was followed by aggregating the data to the right level for modeling.
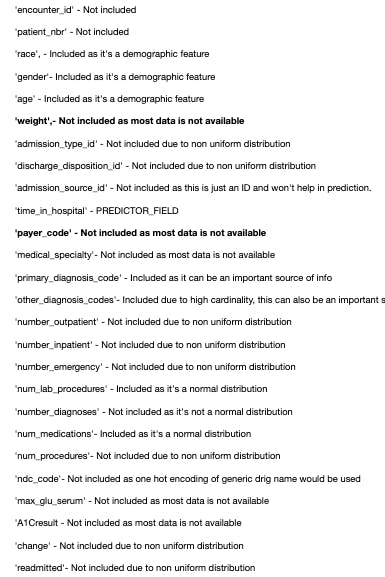
Feature Selection:
I excluded the payer_code and weight fields because most of them were missing data.
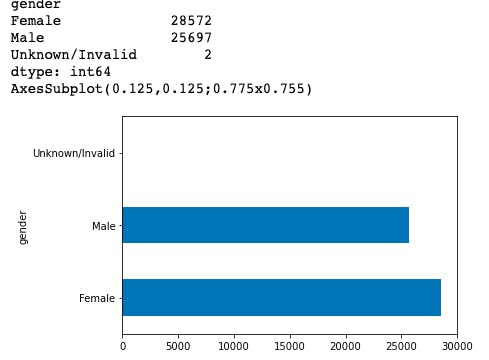
Data Splitting:
I split the data into training, validation and test on a 60%,20%,20% aggregate, then visualized the demography of split.
I also analyzed these splits made and visualized them.
Then I converted the split data into Tensorflow datasets, built a vocabulary for the converted dataset and created categorical features with Tensorflow feature column API. Next, I created numerical features with Tensorflow feature columns.
Model Building:
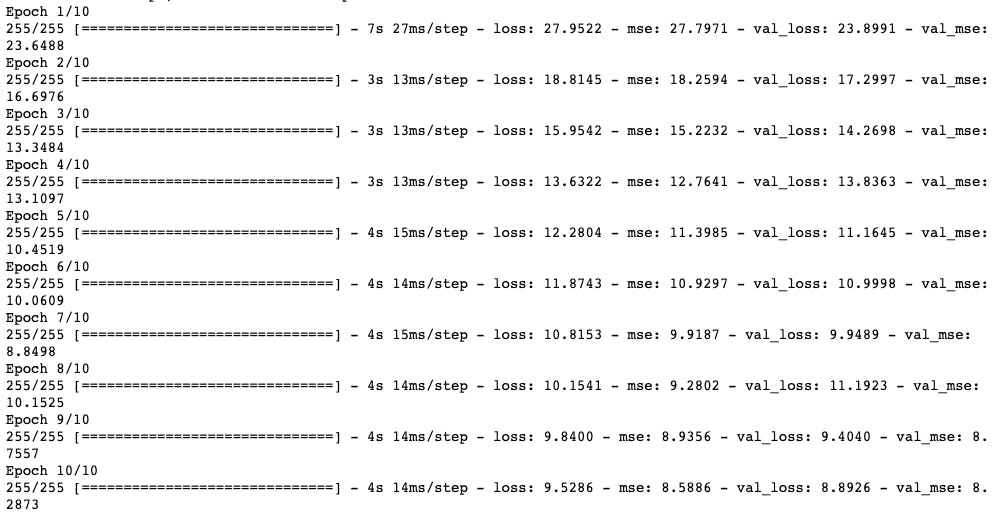
I built two models; a sequential model and diabetes model with relu activation, rmsprop as optimizer, mse as loss metric with early stoppage and 10 epochs.
Prediction:
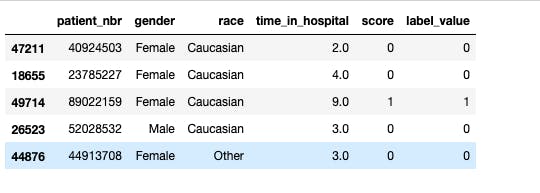
I checked the prediction output, converted the regression output to classification output for patient selection by adding binary prediction to test dataframe.
Model Evaluation:
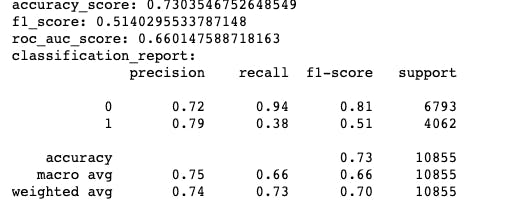
I evaluated the model using AUC, recall, precision and F1 score with an accuracy of 73%.
Bias Evaluation:
I evaluated potential biases using the Aequitas bias toolkit and selected the reference group.
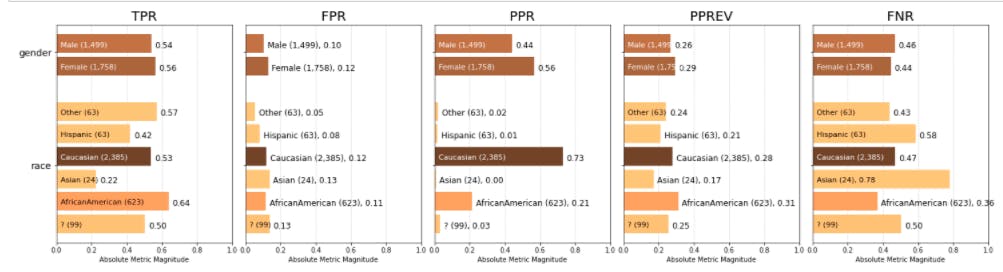
Bias Analysis:
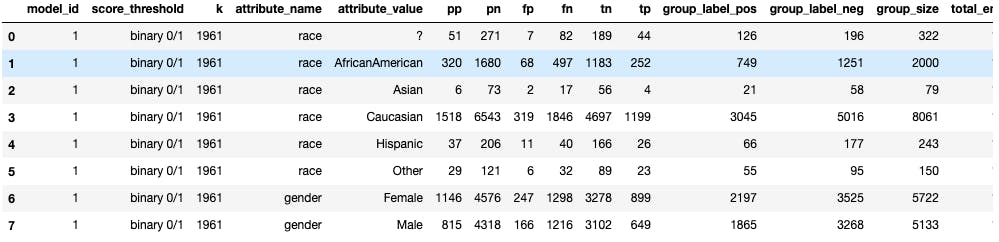
I analyzed the race and gender field bias for patient selection which showed that gender seem to be lacking bias while in race, PPR is higher for Caucasian compared to any other group. High precision for Caucasian means it would have less false positives. This would also mean that Caucasians would meet the predictions more often than other groups in this model.
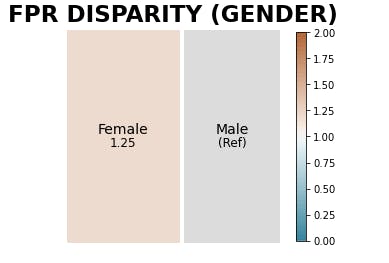
Fairness Analysis:
I performed a fairness analysis relative to a reference group which was the gender and found not much disparity across each gender.
Conclusion:
This project helped to strengthen my knowledge of AI in healthcare with concentration on using EHR for demographic selection in the case of clinical trials. The code can be found in my repo and you can tune the hyperparameters to get better scores than I did. You can connect with me on LinkendIn for suggestions and corrections. Thank you for reading.