Heart Disease Classification

I just want to drink coffee and build stuff
Problem Statement:
Detection of presence or absence of cardiovascular disease based on: Age Height Weight Gender Smoking Alcohol intake Physical activity Systolic Blood Pressure Diastolic Blood Pressure Cholesterol Glucose.
Data:
The dataset used for this project was sourced from Kaggle .
Importing library: I imported the following libraries:
pandas as pd numpy as np seaborn as sns matplotlib.pyplot as plt tensorflow as tf
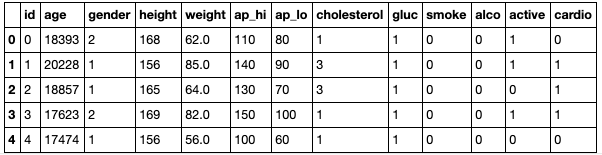
Using the pandas read_csv function, I loaded the dataset and using the .head fucntion, I got the first five rows of the dataset.
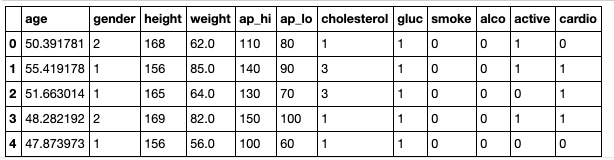
I dropped the id column and converted the age into years as the given age in the dataset was in days. This is the result when .head function is used.
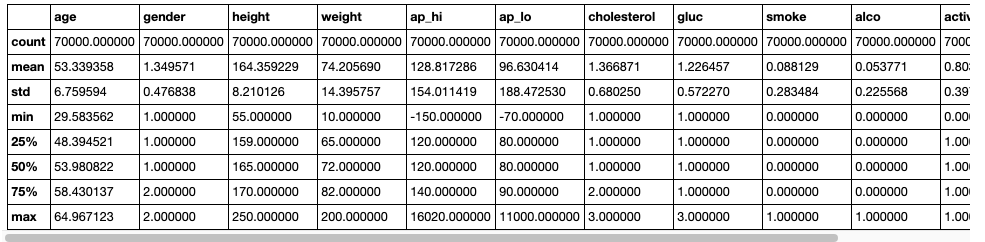
Then I checked for null values and also the statistical summary of the dataset.
Data Visualization:
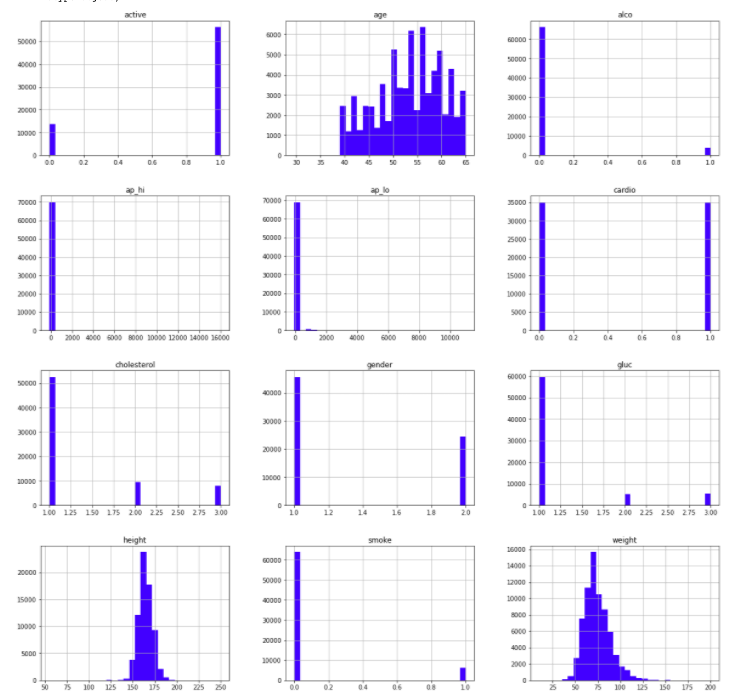
I Visualized the dataset by plotting histogram graph using matplotlib.pyplot.
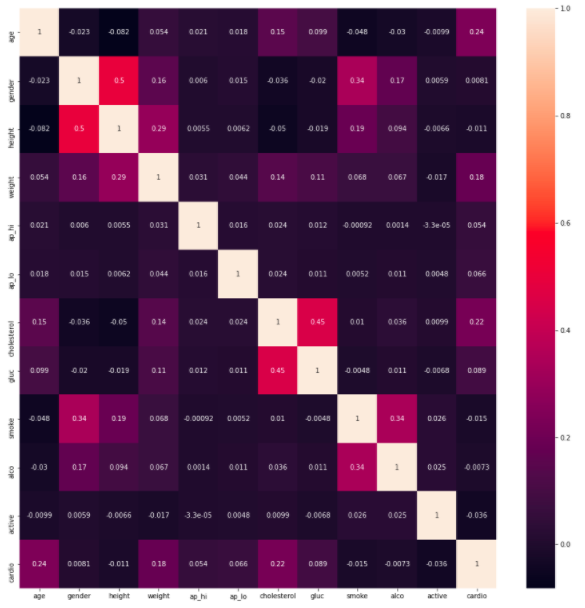
Then using seaborn, I plotted the correlation of features as a heatmap.
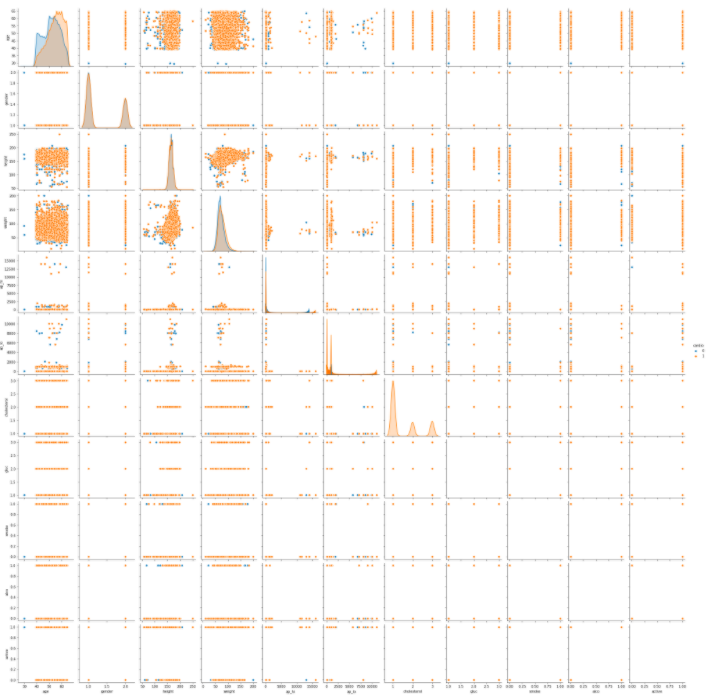
I also did a pairplot.
Splitting dataset:
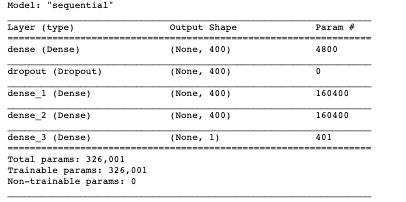
I split the dataset into train and test and using Artificial Neural Network feature scaling which is the standard scaler. I built a classifier using sigmoid activation and relu. Using the summary function, the result:
Training:
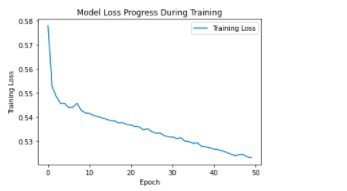
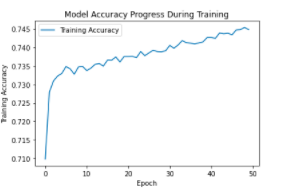
I compiled the model using Adam as optimizer, binary crossentropy as loss and metrics 'accuracy', then finally number of steps was set to 50 epochs. It resulted to 74% accuracy.
Model Evaluation:
I evaluated the model by plotting graphs of model loss progress and accuracy progress during training.
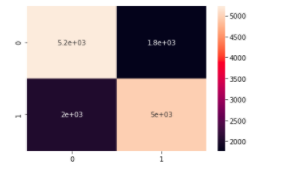
I also evaluated the test set performance using a heat map
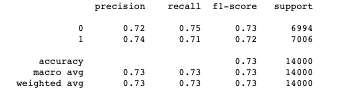
Finally, I printed the scores from the data using scikit-learn classification report.
Conclusion:
This project is from my Udemy course. For more suggestion, I can be reached through my LinkedIn profile. This is the Github repo of this project.


