Data Analysis with Visualization: Covid-19 Vaccine Progression

I just want to drink coffee and build stuff
The novel Coronavirus disease also known as COVID-19, is a new strain of SARS-Cov-2 that has ravaged the world as a global pandemic with its rapid spread and high mortality. This has brought together the different stakeholders in the world from the government to academia to researchers and scientists to curb this virus through vaccine development and testing. Currently, there are varieties of vaccines all around the world in different countries and this analysis seeks to monitor its progression.
Problem Statement:
Tracking the progress of the Covid-19 vaccine in Nigeria in comparison to Africa and the world.
Data:
The data used in this analysis was collected from Kaggle . This dataset contains the data from all countries of the world with the following features:
Country- this is the country for which the vaccination information is provided;
Country ISO Code - ISO code for the country;
Date - date for the data entry; for some of the dates we have only the daily vaccinations, for others, only the (cumulative) total;
Total number of vaccinations - this is the absolute number of total immunizations in the country;
Total number of people vaccinated - a person, depending on the immunization scheme, will receive one or more (typically 2) vaccines; at a certain moment, the number of vaccination might be larger than the number of people;
Total number of people fully vaccinated - this is the number of people that received the entire set of immunization according to the immunization scheme (typically 2); at a certain moment in time, there might be a certain number of people that received one vaccine and another number (smaller) of people that received all vaccines in the scheme;
Daily vaccinations (raw) - for a certain data entry, the number of vaccination for that date/country;
Daily vaccinations - for a certain data entry, the number of vaccination for that date/country;
Total vaccinations per hundred - ratio (in percent) between vaccination number and total population up to the date in the country;
Total number of people vaccinated per hundred - ratio (in percent) between population immunized and total population up to the date in the country;
Total number of people fully vaccinated per hundred - ratio (in percent) between population fully immunized and total population up to the date in the country;
Number of vaccinations per day - number of daily vaccination for that day and country;
Daily vaccinations per million - ratio (in ppm) between vaccination number and total population for the current date in the country;
Vaccines used in the country - total number of vaccines used in the country (up to date);
Source name - source of the information (national authority, international organization, local organization etc.);
Source website - website of the source of information;
Preprocessing:
After I imported the needed libraries, loaded the dataset and viewed the informations therein, I created a list of all African countries and stored them in a variable which I named Africa. Then I created a new dataframe that was grouped by the following columns: country iso_code vaccines total_vaccinations people_vaccinated people_fully_vaccinated daily_vaccinations total_vaccinations_per_hundred people_vaccinated_per_hundred people_fully_vaccinated_per_hundred daily_vaccinations_per_million
World Focus:
I analyzed the total number of vaccinations around the world by ranking of the first 20 countries
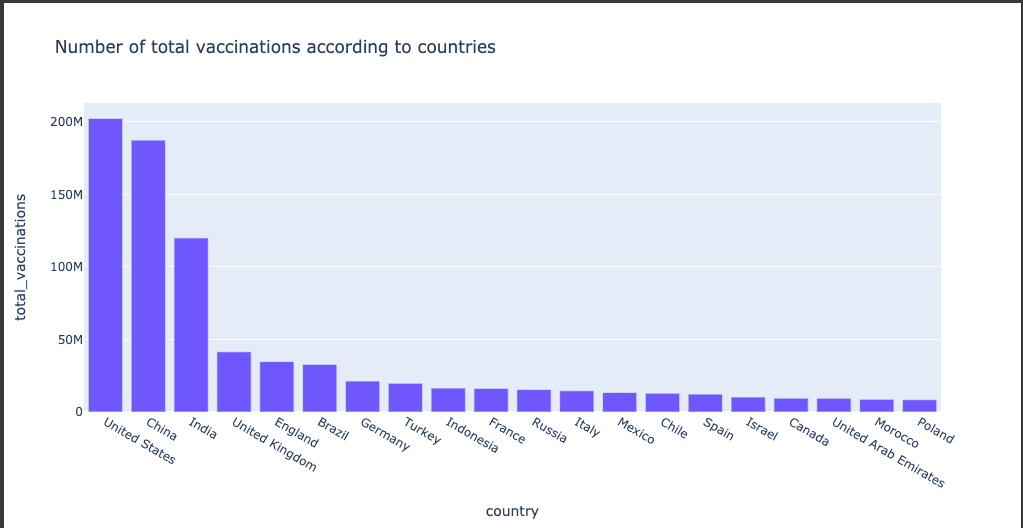
From the above graph, it shows the United States as the number one in the world with total number of vaccinations done while Bangladesh ranked the least.
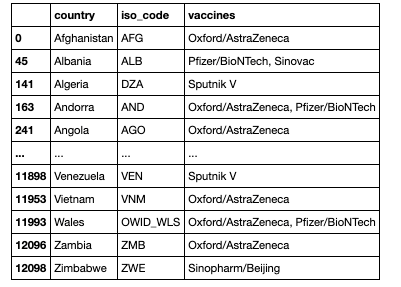
I visualized the types of vaccines available to the countries which it is supplied to
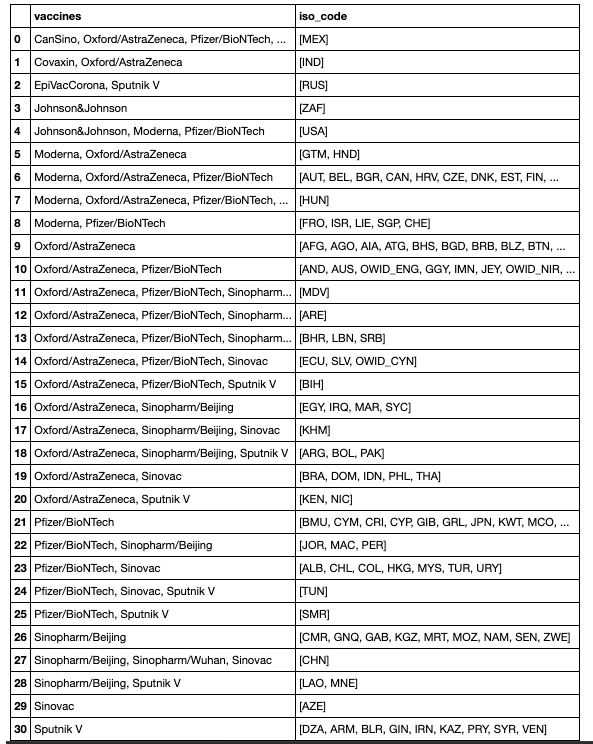
Then the total distribution so far around the world
Focus On Africa:
I analyzed the top 20 countries in Africa in terms of their vaccination rate
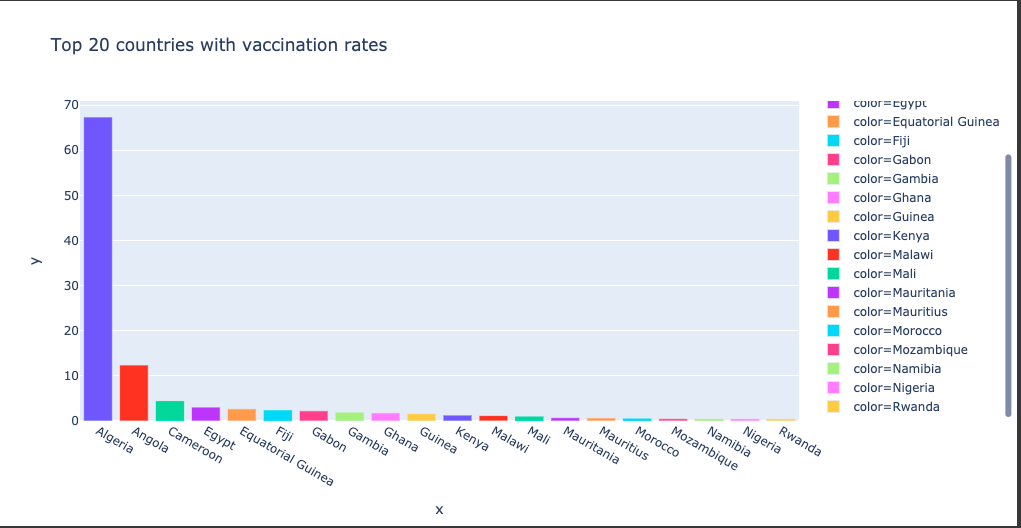
The above graph shows that Algeria has the highest number of vaccination rate with Mozambique, Nigeria, Namibia and Rwanda occupying the least vaccination rates.
Focus on Nigeria:
I tried analyzing the cumulative vaccination in Nigeria and came up with an empty graph
The reason for an empty graph in the case of the cumulative vaccination in Nigeria stems from the lack of daily data update and this is a problem that needs to be corrected.
Recommendation:
The Federal Ministry of Health should have a central database that is updated daily with the accurate figures. This will go a long way in tracking both the vaccination progress and the new cases of the virus and will give a clue on how to mitigate the spread in the country.
Conclusion:
The aim of this analysis is to answer the following questions.
- Vaccines used around the world
- Situation in Africa
- Situation in Nigeria.
And also to strengthen my skills on data analysis using visualizations. You can connect with me on LinkedIn and the code can be found in my repository on Github. Thank you for reading.
This analysis was inspired by Hamoye and RachidYZ, a student at EPISEN, France.


