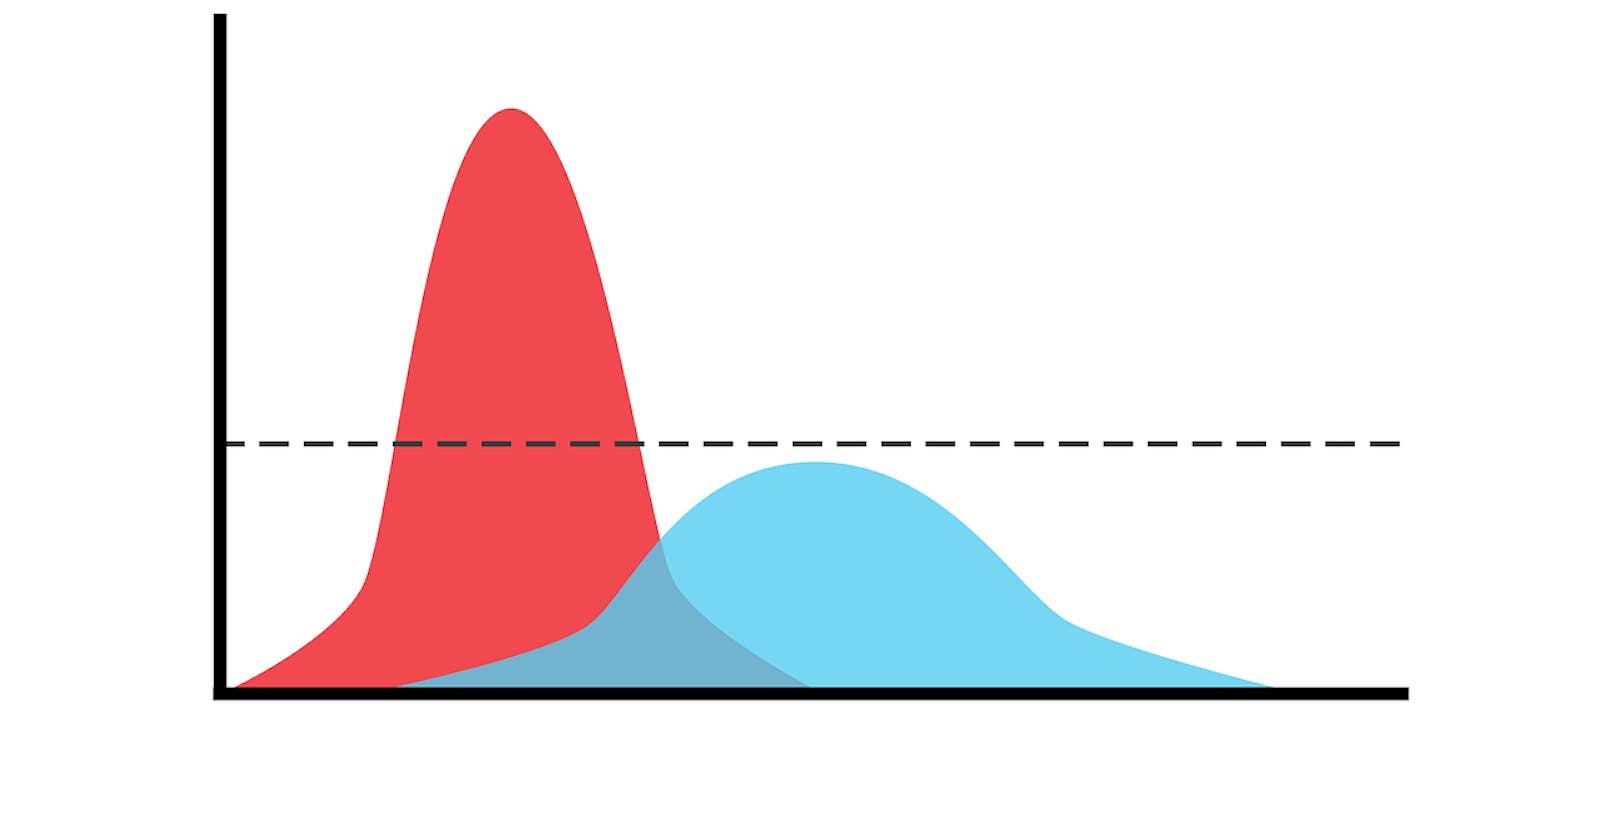
A Gaussian function is a function that cuts across mathematics and statistics. It is also used in signal processing for computer vision.
This function is a type of function that shows continuous probability distribution for a real-valued random variable. This function is characterized by a 'bell-curve' graph which signifies normal distribution.

where:
μ = mean
σ^2 = variance, often written as its square value.
Background:
To represent uncertainty in the estimated location of a self-driving vehicle.
Calculation:
After importing the required library, I set the Gaussian function using the above equation and putting the exponential and coefficient into consideration. Running an example function.

Visualization:
I plotted a graph to display Gaussian over a range of x values after defining parameters.

Finally, I maximized a Gaussian by setting μ and σ equal.

Conclusion:
This is a short tutorial to show how to calculate a Gaussian function and you can go a step further by changing the parameters. This is from my Udacity course. The code to this can be found in my repo and you can connect with me on LinkedIn . Thank you for reading.
